Skip to content
Slope operations

Skier flow

How many people there are, where they move and which slopes fill up

plataforma.snowlytics.tech
Skier flow
The challenge

Without data, slope overcrowding is discovered through accidents or complaints. And you never know which slopes are under-used and which are missing.

What you control
  • Real-time occupancy of every slope
  • Heat map of cumulative use
  • Skier mix by level
What you get
01

See saturation before it hurts

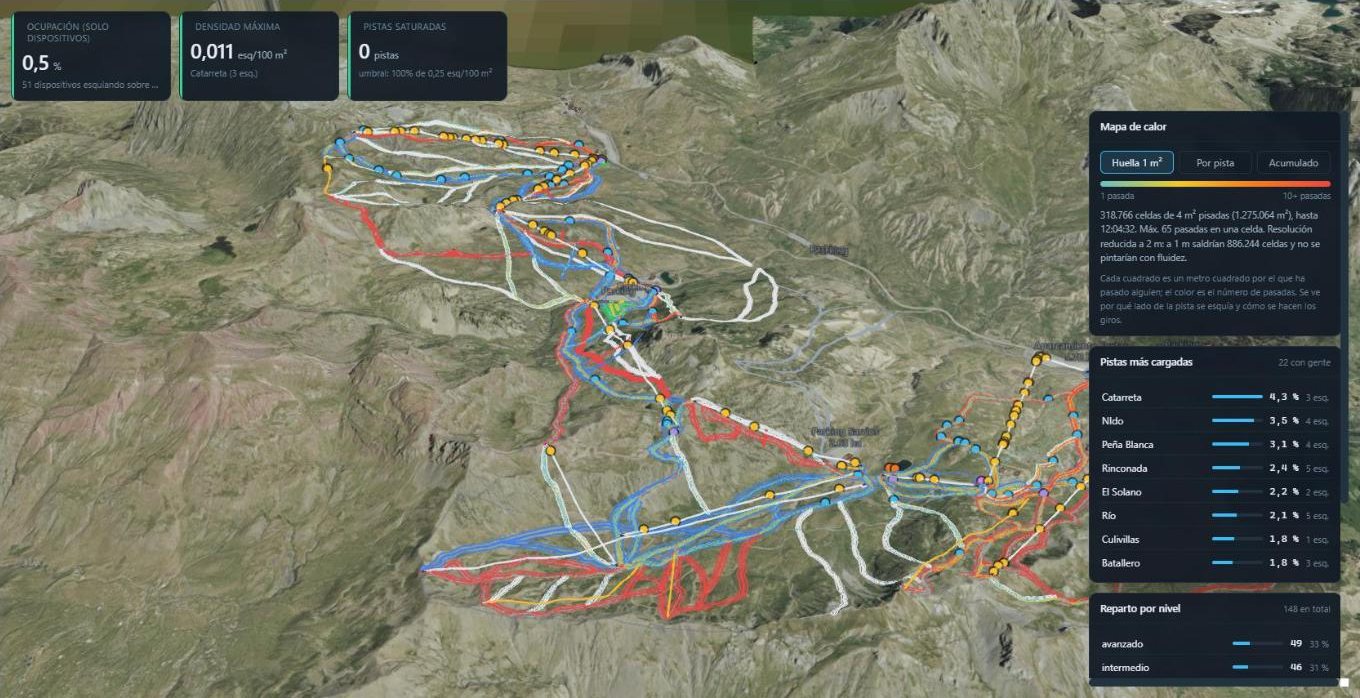
Every slope against its capacity based on its real skiable area: spot the one filling up before it becomes a problem.
02

1 m² footprint

Which side of the slope people ski and how they take the turns: decide where to mark, widen or groom.

03

The day's flow curve

How skiers arrive and spread out during the day, to size staff and openings.

04

Better investment decisions

Real usage data to decide which slope to extend, open or close next season.

plataforma.snowlytics.tech
Skier flow
Everything it does
  • Heat map of use on every slope
  • Footprint down to 1 m²
  • Theoretical capacity against real occupancy
  • Daily and hourly flow curve
  • Skier mix by level
  • Typical day per season from history
  • Inflow by access point and ticket
Indicators you will have on screen
  • Occupancy per slope
  • Skier-minutes per 100 m²
  • Ski footprint
  • Daily curve

See how much this module gives you back

Queues and throughput (Queues, Skier flow)

Calculate your return

See your resort in Snowlytics

We will show you the platform with your resort's map. No commitment.